Gantt chart for a final year project
This Gantt chart is a starting template named **Final year project**. It has no tasks or dates yet, so you can fill it in with your own project timeline. It is for students who need to plan their final year project and show their supervisor a clear schedule.
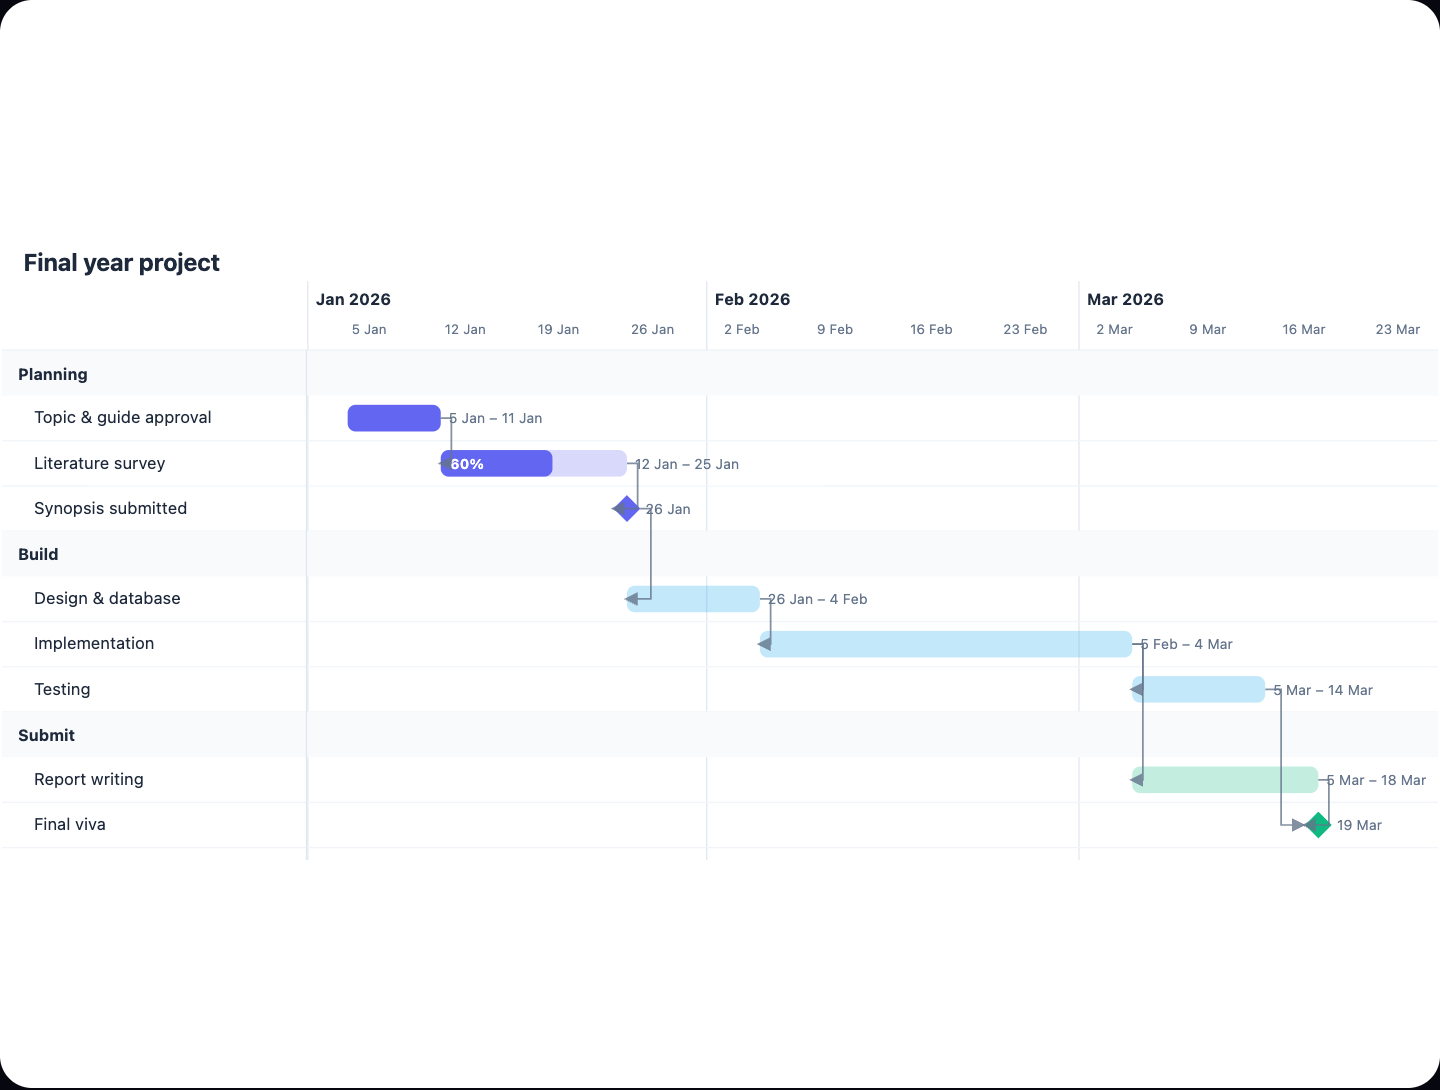
Example: Gantt chart for a final year project: click to open it in the editor and change it.
What is in this diagram
The diagram has one item: its name, Final year project. It does not list any tasks, phases, dates or milestones yet. Treat it as an empty canvas that you build on.
How a Gantt chart works
Once you add content, a Gantt chart is read from left to right along a time axis. Each row is one task.
- Tasks are the rows. Each task is a piece of work, such as writing a chapter.
- Bars show when a task starts and ends. A longer bar means more time.
- Dependencies link tasks where one cannot start until another finishes.
- Milestones mark key moments, such as a deadline, with no duration.
How to adapt it for your project
These are suggestions for what to add. None of them is in the diagram yet.
- Get your module's real deadlines, such as the proposal, interim report and final submission dates, and add them as milestones.
- Split the work into phases that fit your project, for example research, design, building or experiments, testing, and writing.
- Break each phase into smaller tasks that take about one to two weeks each.
- Give each task a start date and an end date, working backwards from your deadlines.
- Link dependent tasks. For example, testing usually depends on building.
- Leave buffer time before each deadline for feedback and fixes.
| Element to add | Why it helps |
|---|---|
| Milestones | Keeps fixed deadlines visible |
| Phases | Groups related tasks |
| Dependencies | Shows what blocks what |
| Buffer time | Absorbs delays |
Tip: Update the chart every week and compare planned bars with what you actually did. Showing this to your supervisor early makes it easier to adjust scope before a deadline is at risk.
Frequently asked questions
What should a Gantt chart for a final year project include?
It should include your official deadlines as milestones, the main phases of your work, and the smaller tasks within each phase with start and end dates. Add dependencies between tasks and some buffer time before deadlines.
Does this template already contain tasks?
No. The diagram only has the name Final year project. You add your own tasks, dates and milestones to fit your course and topic.
How detailed should my final year project Gantt chart be?
Aim for tasks that last about one to two weeks. Much longer tasks are hard to track, and very short ones make the chart cluttered.
Make your own gantt chart with AI →