IT company organizational chart
This IT company organizational chart shows how a small IT services firm is structured, from the **CEO** down to client project managers and functional teams. It is for operations, HR, finance and IT managers who need a clear starting point to document roles, owners and reporting lines.
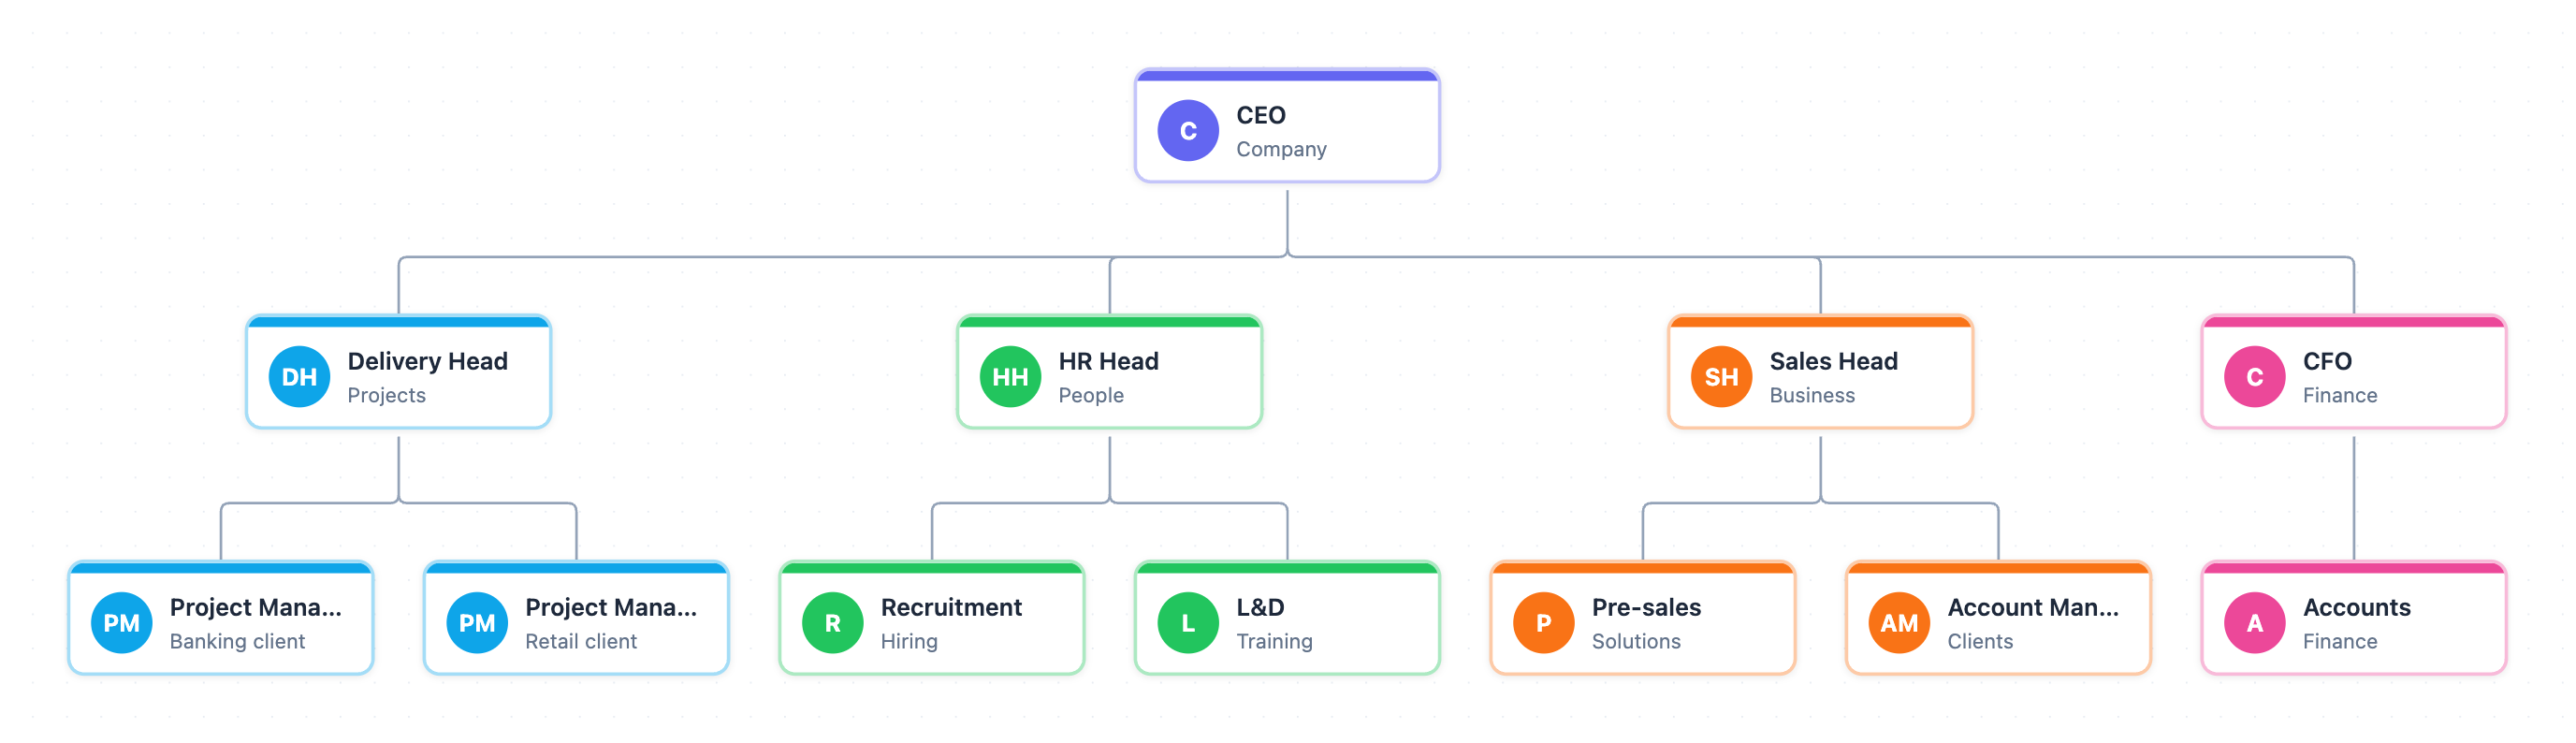
Example: Org chart for an IT services company: click to open it in the editor and change it.
How the chart is structured
The chart has three levels and 12 roles. The CEO sits at the top with four direct reports. Each of them heads a color-coded function with its own team.
| Function | Head (reports to CEO) | Direct reports |
|---|---|---|
| Projects | Delivery Head | Project Manager A (Banking client), Project Manager B (Retail client) |
| People | HR Head | Recruitment (Hiring), L&D (Training) |
| Business | Sales Head | Pre-sales (Solutions), Account Managers (Clients) |
| Finance | CFO | Accounts |
Reporting lines and hand-offs
The chart draws reporting lines only. It does not show process flows. Still, the structure tells you where work has to cross between functions.
- Delivery is organized by client. Each project manager owns one account and reports to the Delivery Head.
- A won deal moves from Pre-sales and Account Managers (under the Sales Head) to a project manager (under the Delivery Head). This is a cross-function hand-off with no shared manager below the CEO.
- Hiring needs come from project managers, but Recruitment reports to the HR Head.
- Billing for client projects depends on delivery data reaching Accounts, which reports to the CFO.
Where this process usually slows down
- CEO as the only common approver: any dispute between Sales, Delivery, HR and Finance escalates to one person.
- Delivery Head span of control: every new client adds another project manager directly below this role.
- No dotted line between Account Managers and project managers, so client exceptions and SLA issues can lack a clear owner.
- A single Accounts team handles all client billing for both accounts.
How to adapt it for your project
- Rename the boxes to your real job titles and add the people who hold them.
- Add or split project managers to match your actual client accounts or service lines.
- Note the approval limits for each head, such as discount, hiring or spend thresholds, so escalations are predictable.
- Add dotted lines for shared ownership, for example between Account Managers and project managers.
Tip: Open and edit it, then put the name of the role that owns each recurring hand-off next to the box. Gaps in ownership become easy to spot.
Frequently asked questions
What roles are in an IT company organizational chart?
This one has a **CEO**, four department heads (**Delivery Head**, **HR Head**, **Sales Head**, **CFO**) and their teams: two project managers, Recruitment, L&D, Pre-sales, Account Managers and Accounts.
How many levels does this IT company org chart have?
It has three levels: the **CEO**, four functional heads, and seven roles or teams reporting to those heads.
Who do project managers report to in an IT services company?
In this chart, both **Project Manager A** (Banking client) and **Project Manager B** (Retail client) report to the **Delivery Head**, who reports to the **CEO**.
Make your own org chart with AI →