Prometheus + Grafana monitoring architecture
This architecture diagram shows a small Docker-based monitoring stack. Prometheus collects metrics, Loki holds logs, and Grafana turns both into dashboards. It is aimed at students and developers who want a clear picture of how these containers connect before they write a docker-compose file.
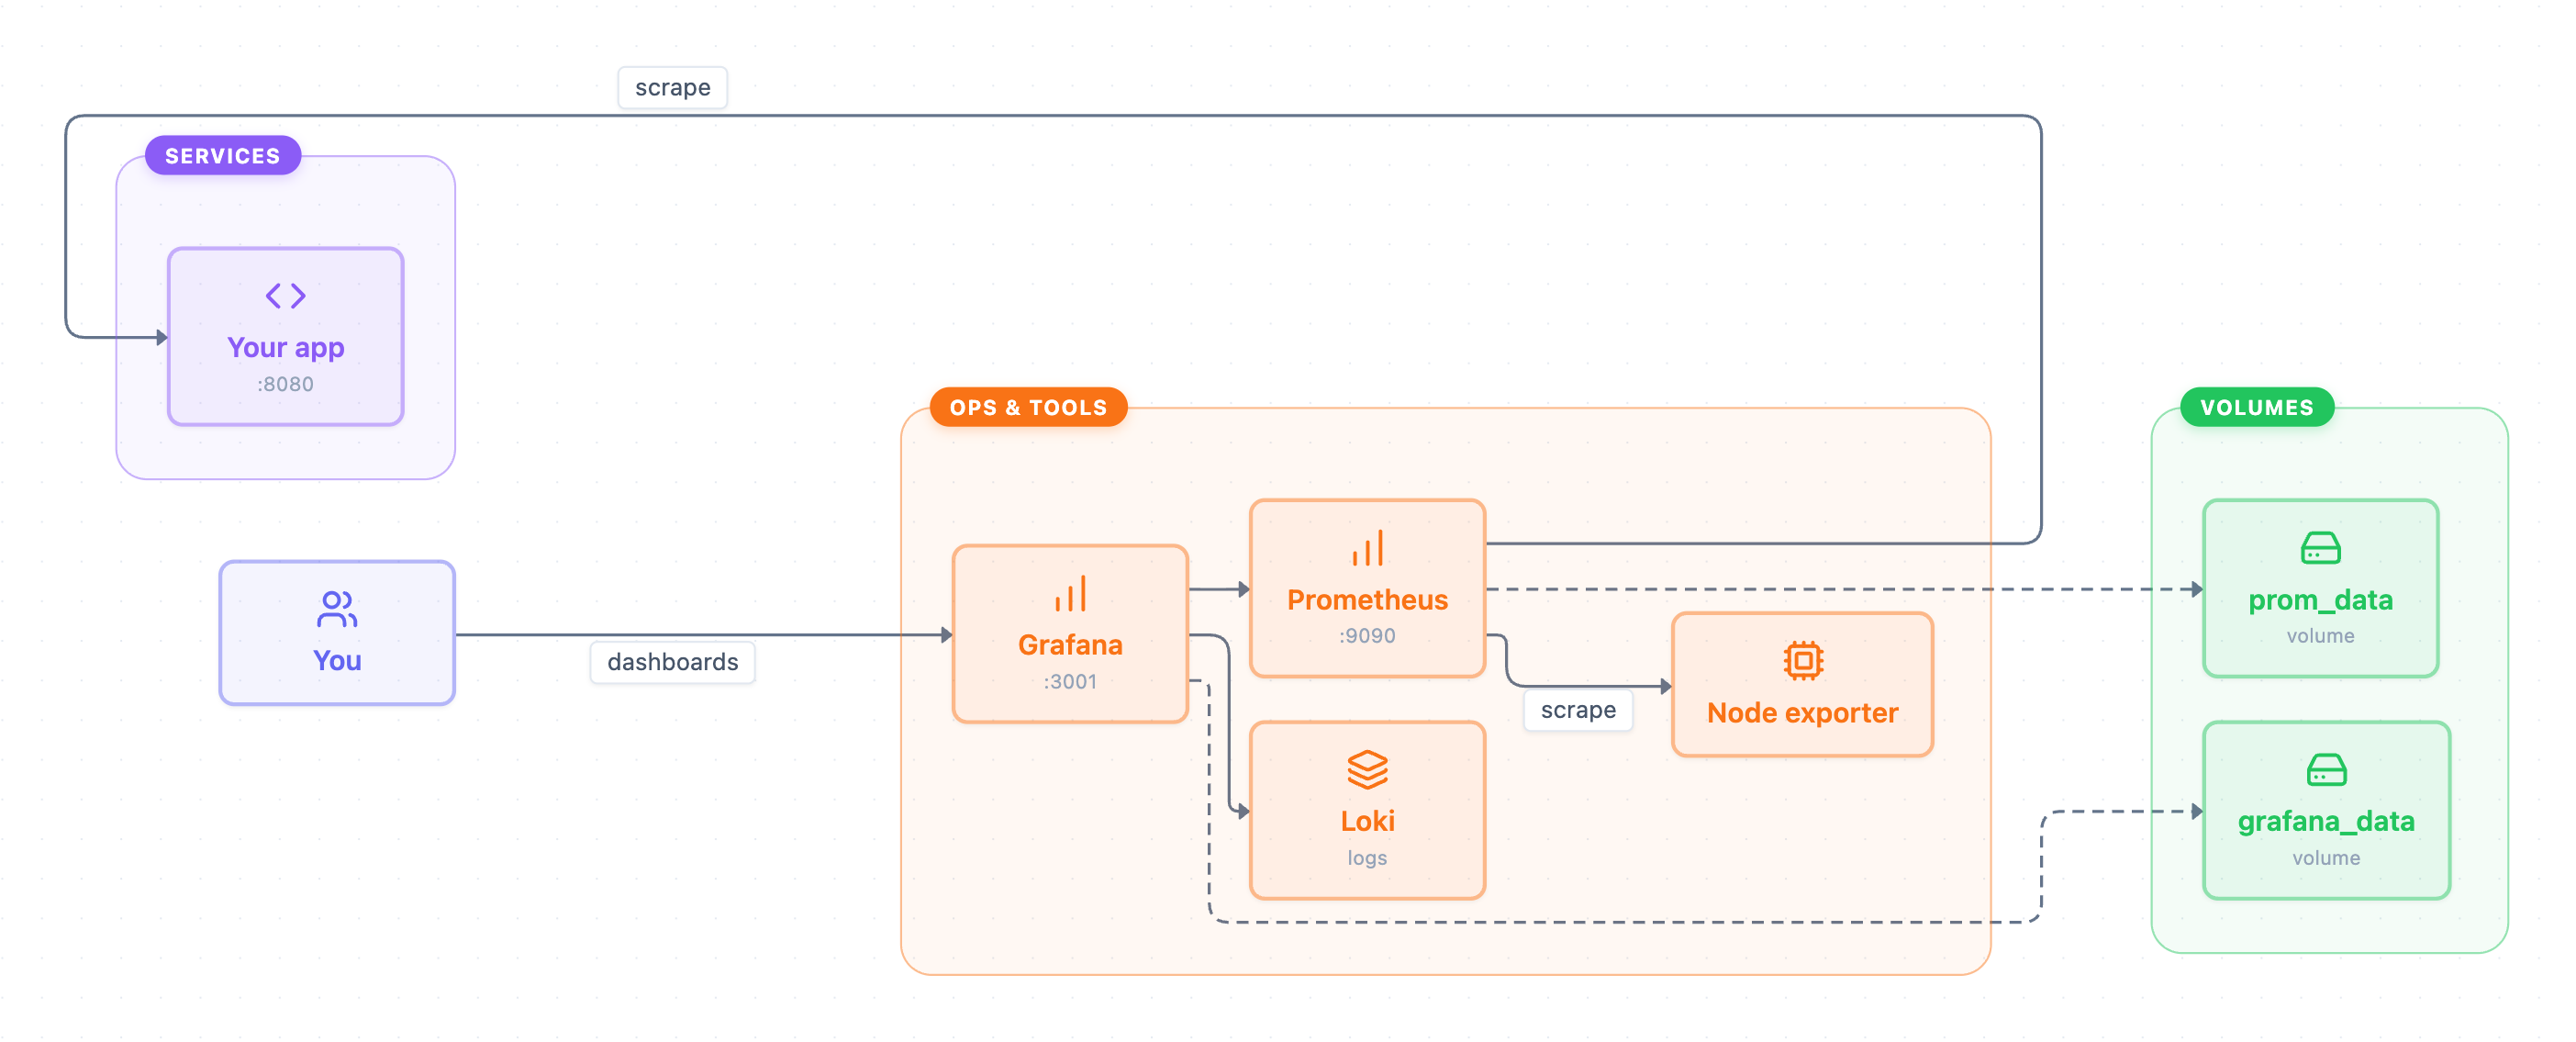
Example: Architecture diagram for Prometheus and Grafana monitoring: click to open it in the editor and change it.
The components
The diagram has three groups: Services, Ops & tools and Volumes. A You node at the top stands for the person viewing the dashboards.
| Component | Group | Port / role |
|---|---|---|
| Your app | Services | :8080, exposes metrics |
| Prometheus | Ops & tools | :9090, scrapes and stores metrics |
| Node exporter | Ops & tools | Host CPU, memory and disk metrics |
| Loki | Ops & tools | Log storage |
| Grafana | Ops & tools | :3001, dashboards |
| prom_data | Volumes | Prometheus data volume |
| grafana_data | Volumes | Grafana data volume |
How data flows
- Prometheus scrapes Your app and Node exporter. Prometheus pulls metrics from these targets on a schedule, so the app does not push anything.
- Prometheus writes its time-series data to the prom_data volume. The dashed line marks storage.
- Grafana queries Prometheus for metrics and Loki for logs.
- Grafana keeps its dashboards and settings in the grafana_data volume.
- You open Grafana to view the dashboards.
The volumes matter because containers are disposable. Without prom_data and grafana_data, a restart would wipe your metric history and saved dashboards.
How to adapt it for your project
- Rename Your app and change :8080 to your real service and port. Add one node per service that Prometheus should scrape.
- Add more exporters next to Node exporter, such as a database exporter, and draw a scrape edge from Prometheus to each one.
- The diagram shows nothing sending logs into Loki. If you use it, add a log shipper and draw its edge into Loki.
- Add a volume for Loki if you need logs to survive restarts.
- Check the Grafana port. It is :3001 here, often to avoid a clash with an app already using 3000.
Tip: Keep the scrape arrows pointing from Prometheus to its targets. That direction shows the pull model, which is the part people most often draw backwards.
Frequently asked questions
What does Prometheus do in a Grafana architecture?
Prometheus scrapes metrics from targets like your app and Node exporter and stores them as time series. Grafana then queries Prometheus to draw dashboards.
Why is Loki included in the Prometheus and Grafana diagram?
Loki stores logs, while Prometheus stores metrics. Grafana connects to both, so you can view metrics and logs side by side.
Why do Prometheus and Grafana need Docker volumes?
The prom_data volume keeps metric history and the grafana_data volume keeps dashboards and settings. With these volumes, the data survives when containers are recreated.
Make your own architecture diagram with AI →