Factorial flowchart, pseudocode and trace table
This flowchart shows an algorithm that calculates the factorial of a number n (for example 4! = 4 × 3 × 2 × 1 = 24) using iteration. It is for GCSE, A-level and AP Computer Science Principles students and teachers who want to practise flowcharts, pseudocode and trace tables with one simple, exam-style example.
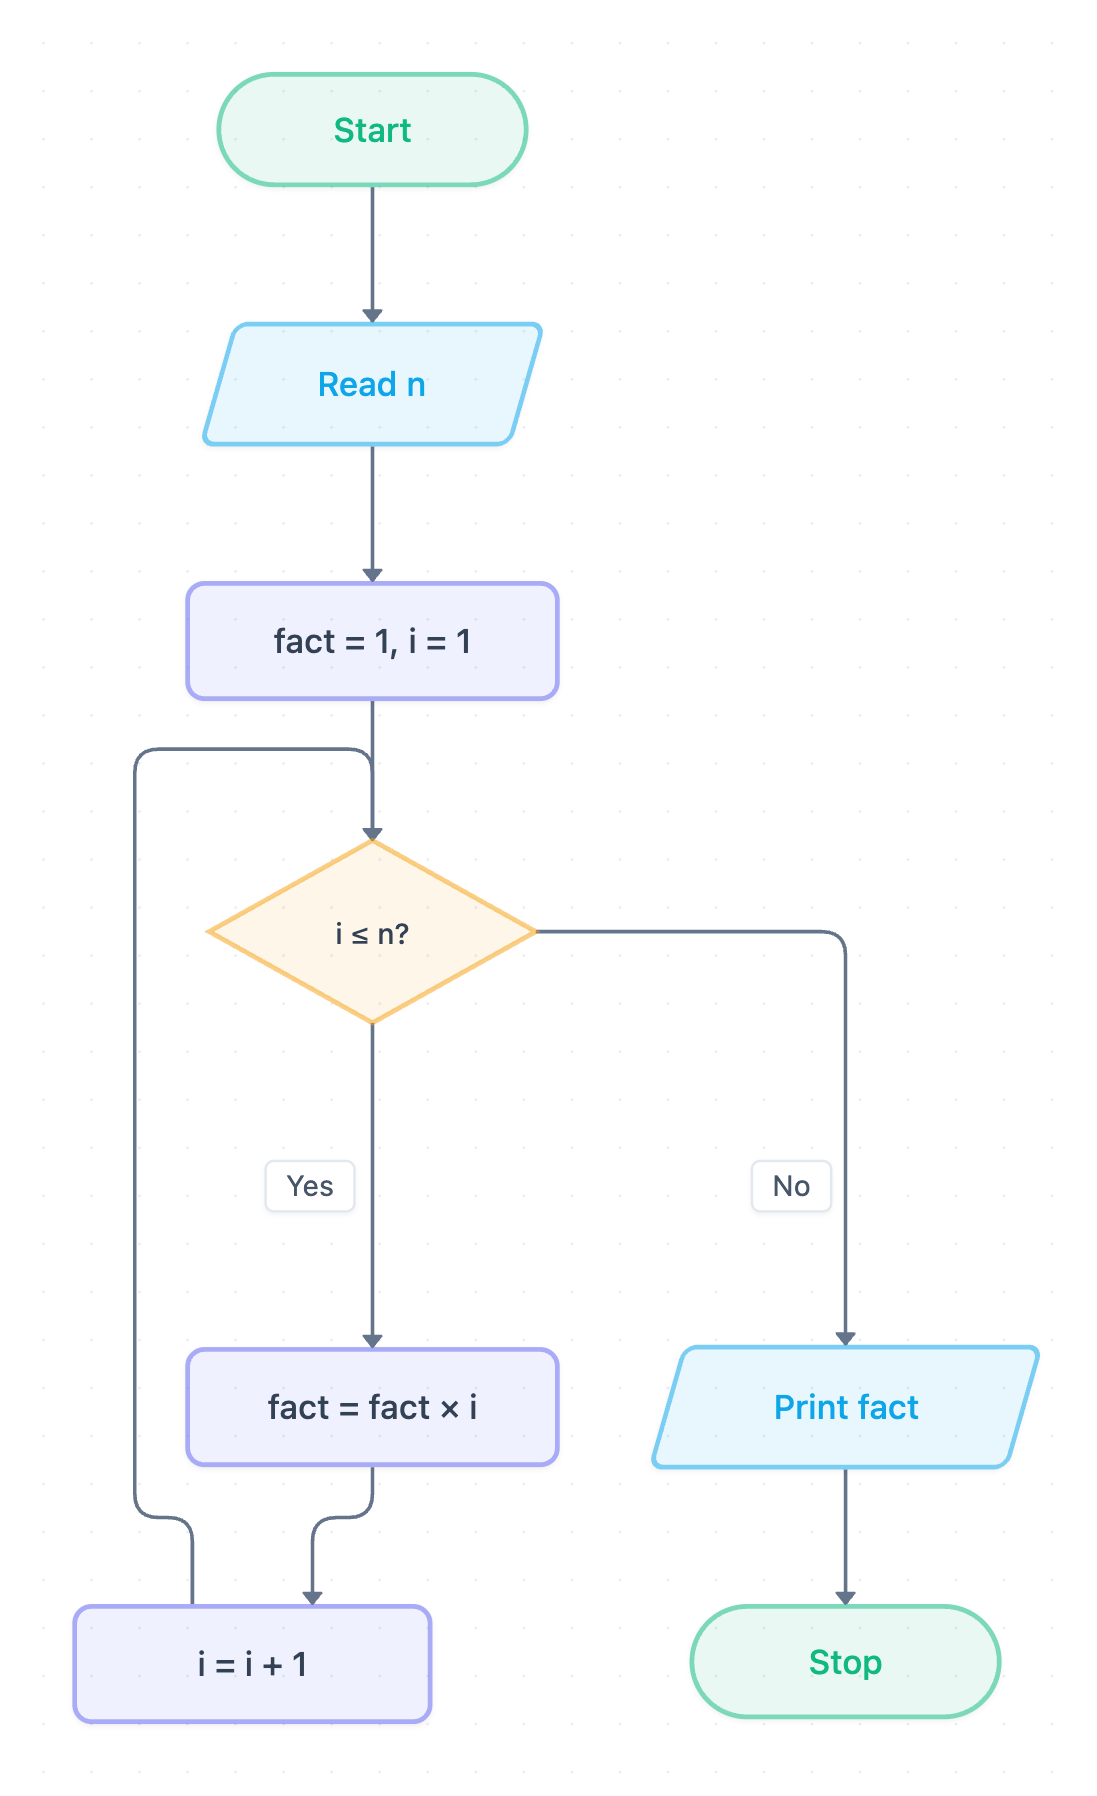
Example: Flowchart for the factorial of a number: click to open it in the editor and change it.
How the factorial algorithm works
The flowchart has one input, one loop controlled by a decision, and one output. It follows these steps in order:
- Start: the algorithm begins.
- Read n: input the number whose factorial you want (parallelogram = input/output).
- fact = 1, i = 1: initialise two variables. fact holds the running product and i is the loop counter.
- i ≤ n?: the decision (selection) that controls the loop. If Yes, go into the loop body. If No, leave the loop.
- fact = fact × i: multiply the running product by the counter.
- i = i + 1: increase the counter, then go back to the decision i ≤ n?.
- Print fact: when the condition is false, output the result.
- Stop: the algorithm ends.
Because the condition is checked before the loop body runs, this is a pre-condition loop, which matches a while loop. If n = 0, the loop never runs and the output is 1, which is correct because 0! = 1.
Pseudocode (OCR Exam Reference Language style)
n = int(input("Enter a number"))
fact = 1
i = 1
while i <= n
    fact = fact * i
    i = i + 1
endwhile
print(fact)
Each line matches one flowchart shape. The while line is the i ≤ n? diamond, and endwhile is the arrow from i = i + 1 back to the decision.
Trace table for n = 4
Each row shows the condition result at the start of a pass and the variable values at the end of that pass.
| Pass | n | i ≤ n? | fact | i | Output |
|---|---|---|---|---|---|
| Initialise | 4 | 1 | 1 | ||
| 1 | 4 | True | 1 | 2 | |
| 2 | 4 | True | 2 | 3 | |
| 3 | 4 | True | 6 | 4 | |
| 4 | 4 | True | 24 | 5 | |
| Exit | 4 | False | 24 | 5 | 24 |
The loop body runs exactly n = 4 times. When i becomes 5, the check 5 ≤ 4 is false, so the algorithm prints 24.
How to adapt it for your project
- Add validation: after Read n, add a decision such as n ≥ 0? that loops back to the input if the user enters a negative number.
- Count down instead: start with i = n and use i = i − 1 with the condition i ≥ 1. This gives the same result.
- Use a rogue value: wrap the whole algorithm in an outer loop that keeps asking for numbers until the user enters, say, −1.
- Try a for loop: rewrite the pseudocode as for i = 1 to n … next i and compare it with the while version.
- Open and edit the diagram to change labels, add shapes or try these variations.
Tip: Common exam mistake: writing the condition as i < n instead of i ≤ n. This is an off-by-one error. The loop stops one pass early, so for n = 4 it outputs 6 instead of 24. Always dry-run your loop's last pass with a trace table.
Frequently asked questions
What is the output of the factorial flowchart when n = 4?
It outputs 24. The loop runs four times, and fact goes 1, 2, 6, 24 before the condition i ≤ n becomes false when i = 5.
Why is fact set to 1 and not 0 in the factorial algorithm?
fact is a running product, and multiplying by 0 always gives 0. Starting at 1 also makes the algorithm correctly output 1 when n = 0.
Is the factorial flowchart a while loop or a for loop?
The flowchart checks i ≤ n before each pass, so it maps directly to a while loop. Because the number of passes is known (n), you could also write it as a count-controlled for loop.
Make your own flowchart with AI →