Student grade calculator flowchart
This flowchart shows a simple algorithm that reads a student's marks and uses selection to output Grade A, Grade B, Grade C or Fail. It is aimed at GCSE, A-level and AP Computer Science Principles students and teachers who need a clear example of nested decisions, pseudocode and a trace table.
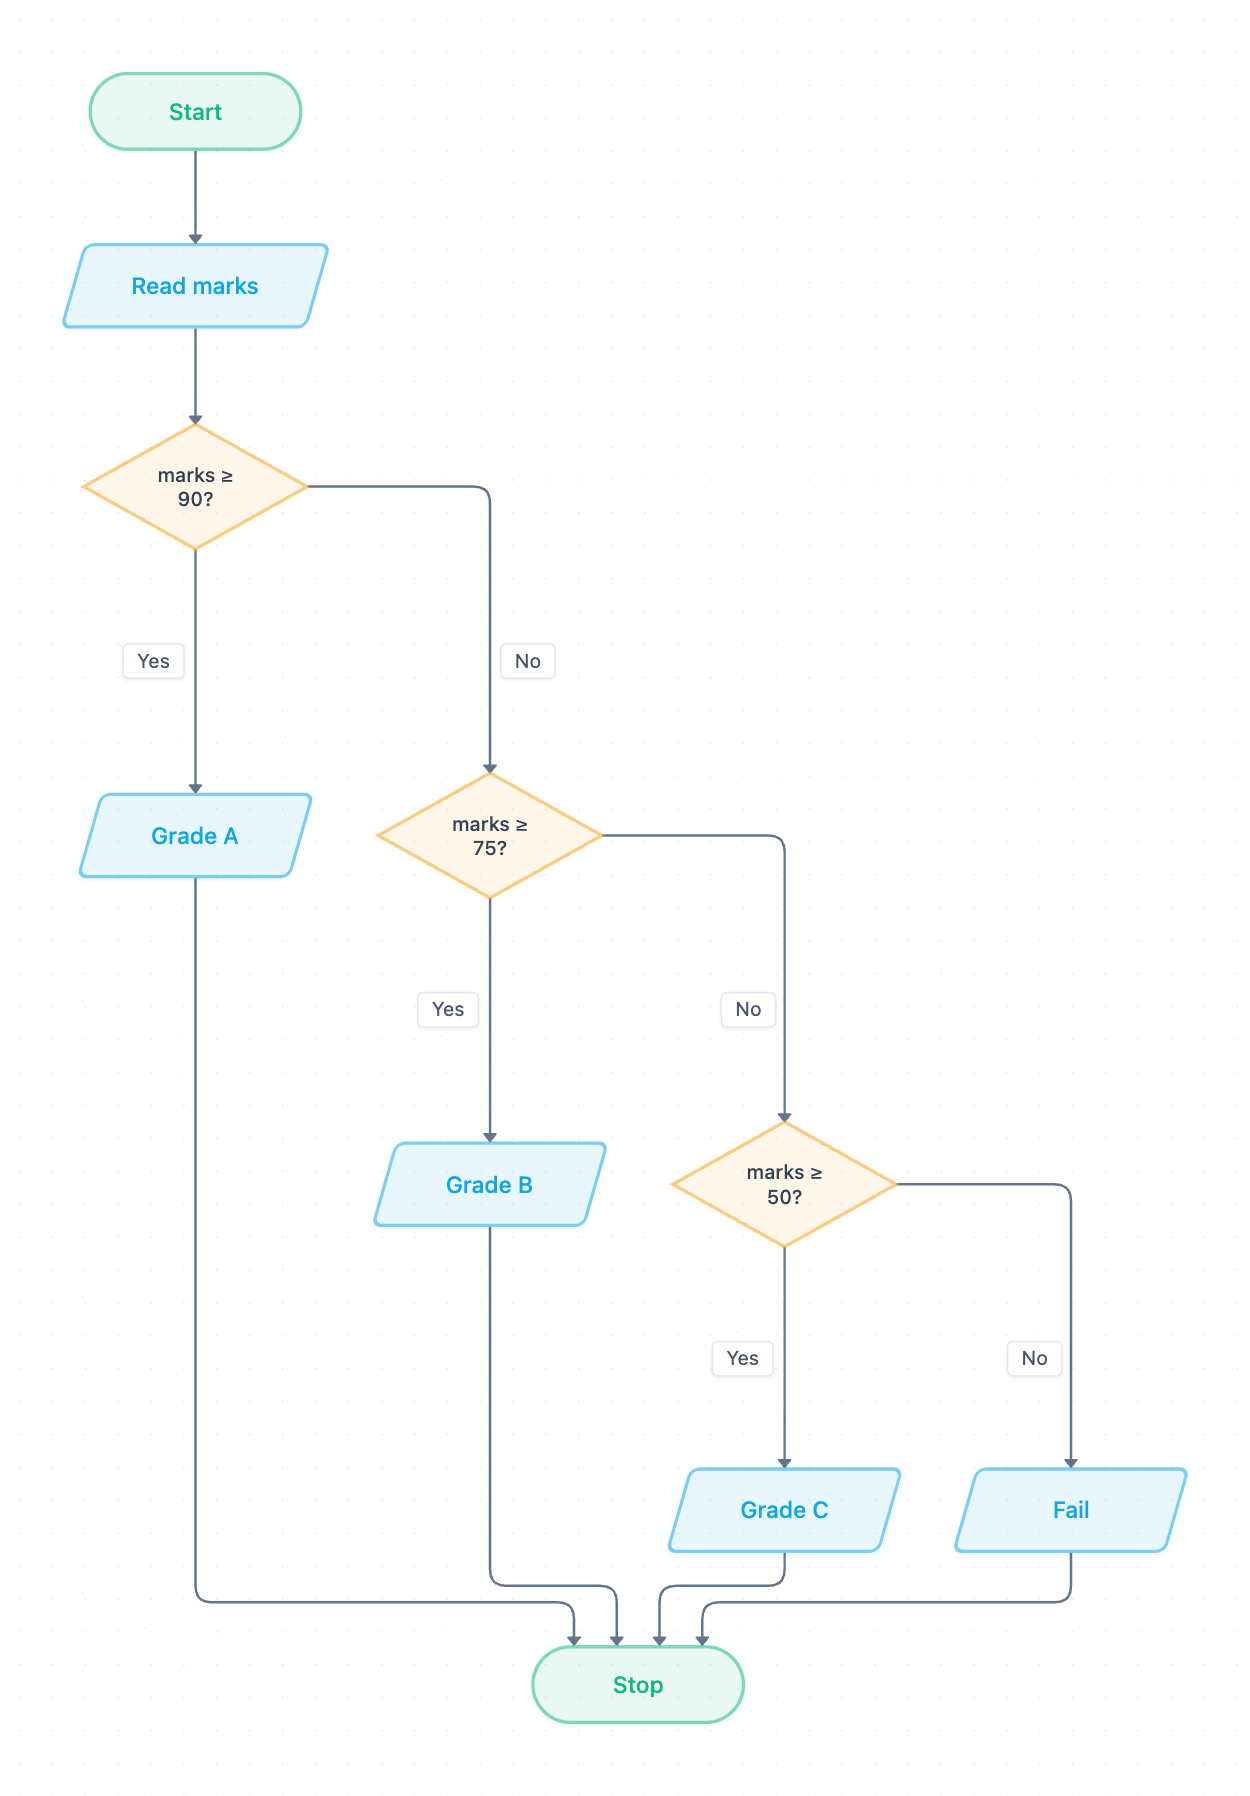
Example: Flowchart for a student grade calculator: click to open it in the editor and change it.
How the algorithm works, step by step
- Start: the algorithm begins.
- Read marks: an input step stores the student's score in the variable marks.
- marks ≥ 90?: if Yes, output Grade A. If No, move to the next decision.
- marks ≥ 75?: if Yes, output Grade B. If No, move to the next decision.
- marks ≥ 50?: if Yes, output Grade C. If No, output Fail.
- Stop: every output path joins here, so exactly one grade is printed.
The decisions are checked from the highest boundary down. A mark only reaches marks ≥ 75? if it has already failed marks ≥ 90?, so the Grade B branch really means 75–89. There is no iteration in this diagram. It processes one mark and then stops.
Exam-style pseudocode (OCR Exam Reference Language)
marks = int(input("Enter marks: "))
if marks >= 90 then
    print("Grade A")
elseif marks >= 75 then
    print("Grade B")
elseif marks >= 50 then
    print("Grade C")
else
    print("Fail")
endif
Each diamond becomes one if or elseif condition. The final No branch becomes the else.
Trace table: input marks = 80
The flowchart has no loop, so the input passes through it once. Each row below is one step of that pass. A dash means the check is never reached.
| Step | marks | marks ≥ 90? | marks ≥ 75? | marks ≥ 50? | Output |
|---|---|---|---|---|---|
| Read marks | 80 | ||||
| Decision 1 | 80 | False | |||
| Decision 2 | 80 | False | True | ||
| Output | 80 | False | True | – | Grade B |
Test data to try
- Boundary values: 90 → Grade A, 89 → Grade B, 75 → Grade B, 74 → Grade C, 50 → Grade C, 49 → Fail.
- Normal values: 95, 60, 20.
- Erroneous values: -5, 150, "abc". The current flowchart has no validation, so these are not rejected.
How to adapt it for your project
- Change the boundaries in the three diamonds to match your school's grading scheme, or add more diamonds for extra grades such as A* or D.
- Add validation after Read marks: loop back to the input while marks < 0 or marks > 100.
- Process a whole class by wrapping the steps in a while loop that stops on a rogue value such as -1. You could also count how many students get each grade.
- Open and edit the diagram, then rewrite your pseudocode so it still matches the flowchart step for step.
Tip: A common exam mistake is checking the conditions in the wrong order, for example testing marks ≥ 50 first. Then a mark of 95 would print Grade C. Another is using > instead of ≥, which gives a mark of exactly 90 a Grade B. Always test the boundary values.
Frequently asked questions
What does a flowchart for student grade calculation show?
It shows an input step (Read marks), three decision diamonds (marks ≥ 90, ≥ 75, ≥ 50) and four outputs: Grade A, Grade B, Grade C or Fail. It is a standard example of selection in an algorithm.
Does this grade flowchart use iteration?
No. It reads a single mark, outputs one grade and stops. To grade several students, add a while loop with a rogue value such as -1 to end input.
Why is the order of the decisions important?
The checks go from the highest boundary down, so each later branch only receives marks that failed the earlier checks. If you reverse the order, high marks would be caught by the ≥ 50 check and given the wrong grade.
Make your own flowchart with AI →